
Ecofocus.io ESG Reporting Platform
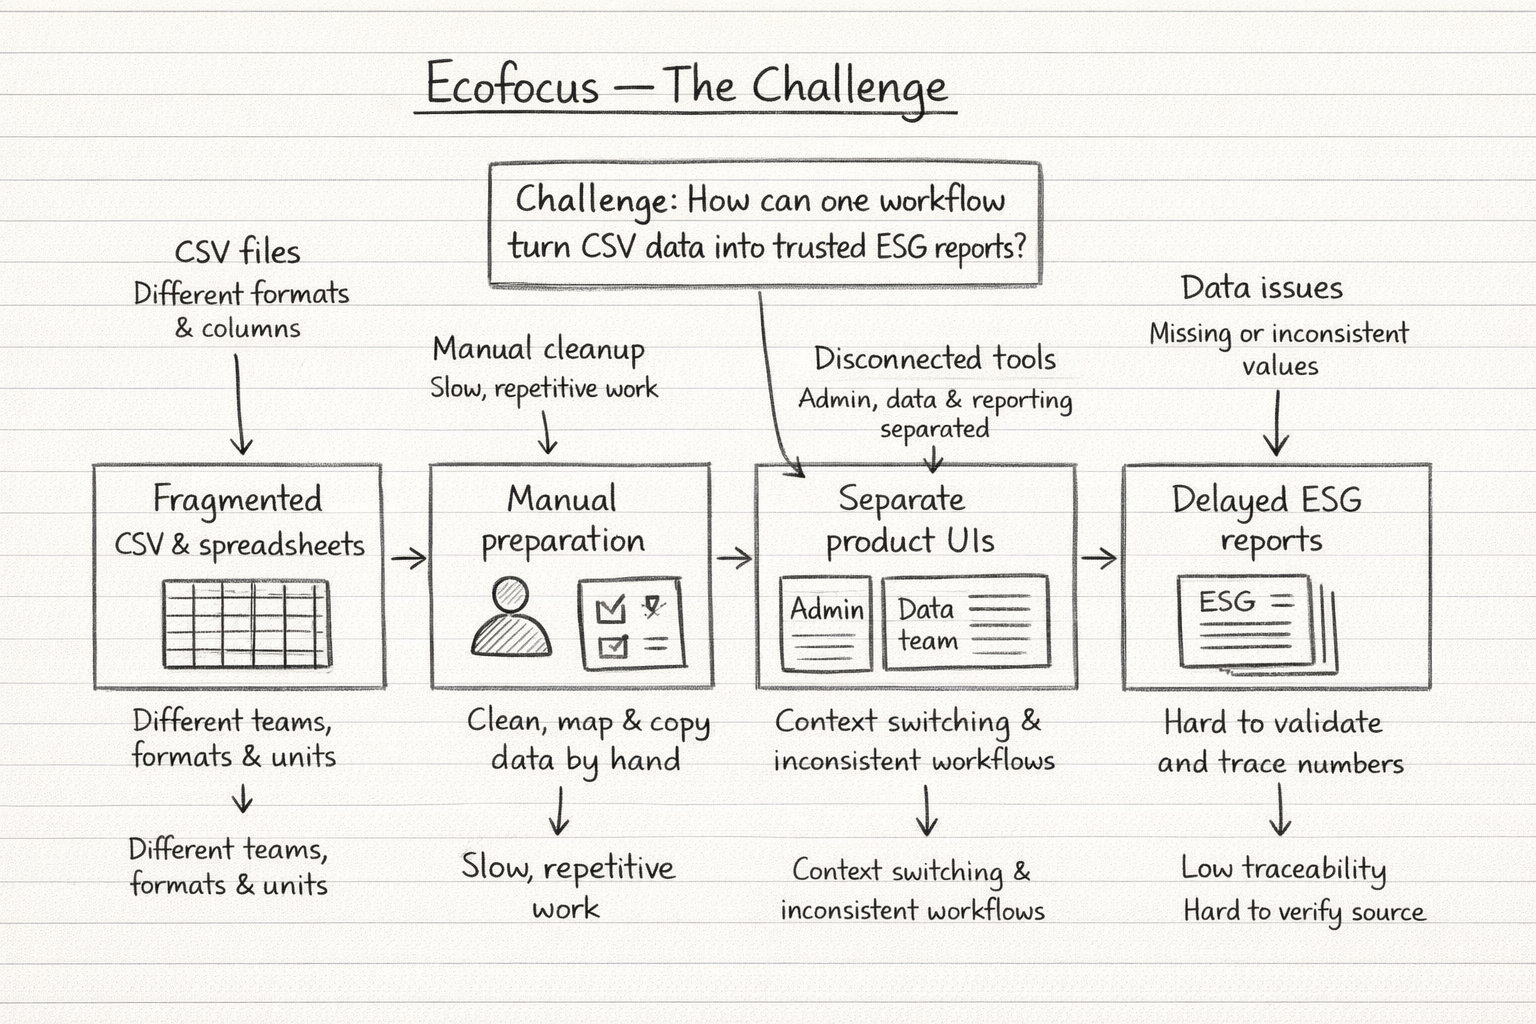
Ecofocus was built to simplify a complex ESG reporting process. Organizations often store environmental, social, and governance data across spreadsheets, operational systems, third-party platforms, and internal databases. Before reporting can begin, that information must be collected, cleaned, mapped, validated, and aligned with reporting frameworks.
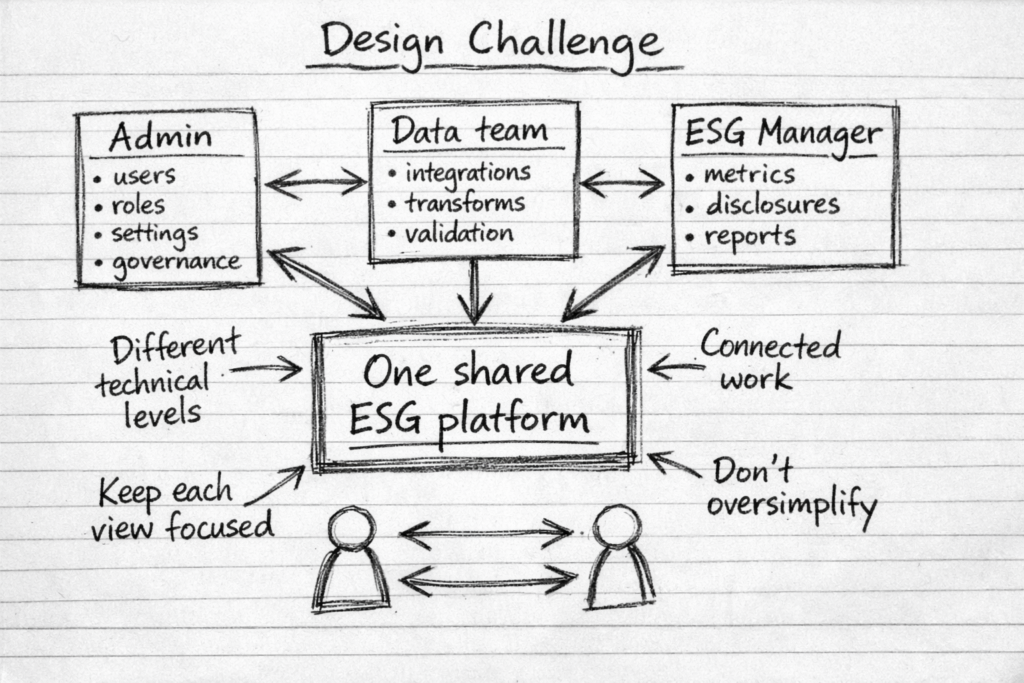
The platform supported complex reporting workflows, but the product experience had grown across separate interfaces for administrators, developers, and ESG reporting users.
As the SaaS UX Designer, I collaborated with Product, Engineering, data specialists, and ESG stakeholders to simplify a complex reporting workflow.
Ecofocus users relied on fragmented CSV and spreadsheet data to produce ESG reports, creating manual work, inconsistent data, and limited traceability. The platform also split admin, developer, and reporting workflows across separate UIs, so the challenge was to create one clear path from CSV upload to validated, framework-ready ESG reporting.
I used a design thinking process to move from fragmented interfaces to an integrated product ecosystem.
Discover
Understand user roles, workflows, pain points, and dependencies.
Define
Identify the most important experience problems and establish a shared product structure.
Design
Create information architecture, user flows, wireframes, prototypes, and a scalable design system.
Validate
Test workflows with representative users and refine the experience based on usability feedback.
Users did not think in terms of technical modules such as “data ingestion” or “pipeline configuration.”
They thought in terms of outcomes:
I need to upload our energy data and use it in our GRI report.
This led us to organize the experience around one clear journey:
Upload CSV → Extract data → Validate data → Map ESG metrics → Complete report
This journey connected technical data preparation to the business outcome users cared about: completing accurate ESG disclosures.
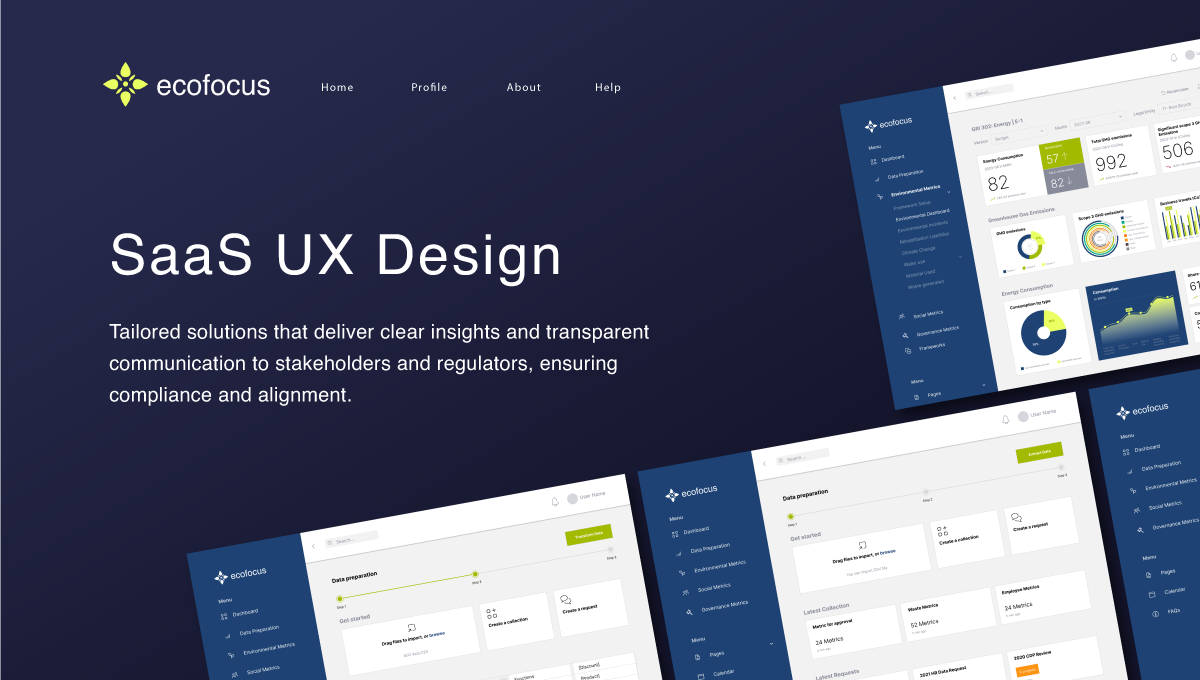
The redesigned platform introduced unified navigation across Overview, Data Hub, Pipelines, Reporting, and Administration. Users could manage data sources, transform and validate data, map it to ESG metrics, complete GRI, SASB, and TCFD disclosures, and trace every reported number back to its source.
A unified enterprise product is not created by making every screen look the same.
It requires a shared mental model, consistent language, clear handoffs, and the right level of complexity for each role.
For Ecofocus, the most important design decision was connecting technical data work to the reporting outcomes ESG teams cared about.